In September 1981, the 10-year US Treasury Bond yield peaked at over 15%. Over the next 39 years, from 1981 to 2020, yields declined leading to an increase in prices, the likes of which has never been seen before. Since the first half of 2020, yields have risen to a level not seen in15 years. Below is a graph of 10-year treasury yields since 1962 from the Federal Reserve System.

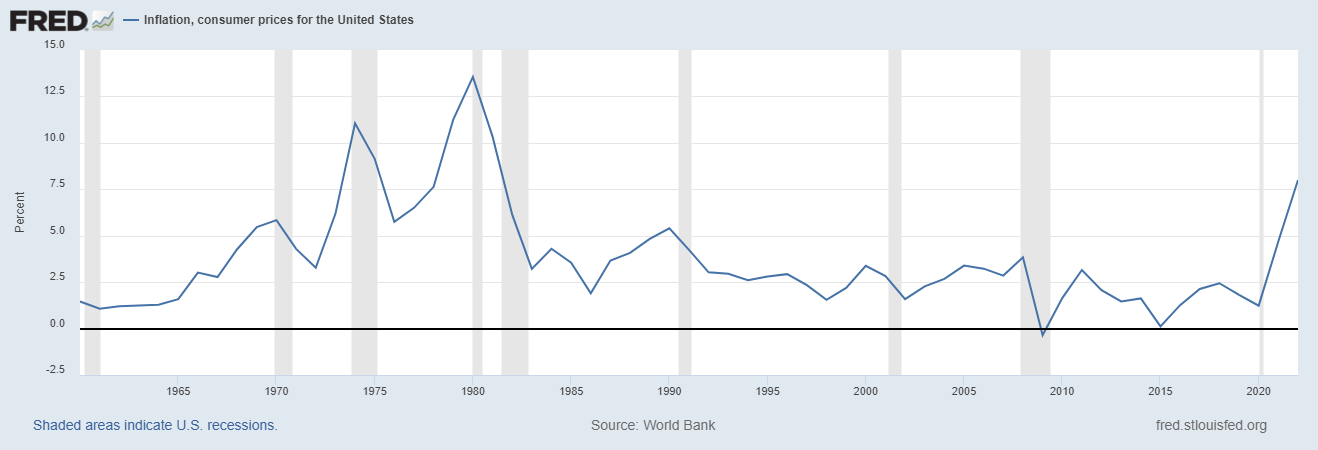
Where are rates going? What is baseline 10-year treasury rate? There is none! Below is a graph on annual inflation in US over the same time period. As you can see, inflation and interest rates are closely tied, because markets demand higher yields when inflation is higher. Again, there does not appear to be a “baseline” inflation rate.

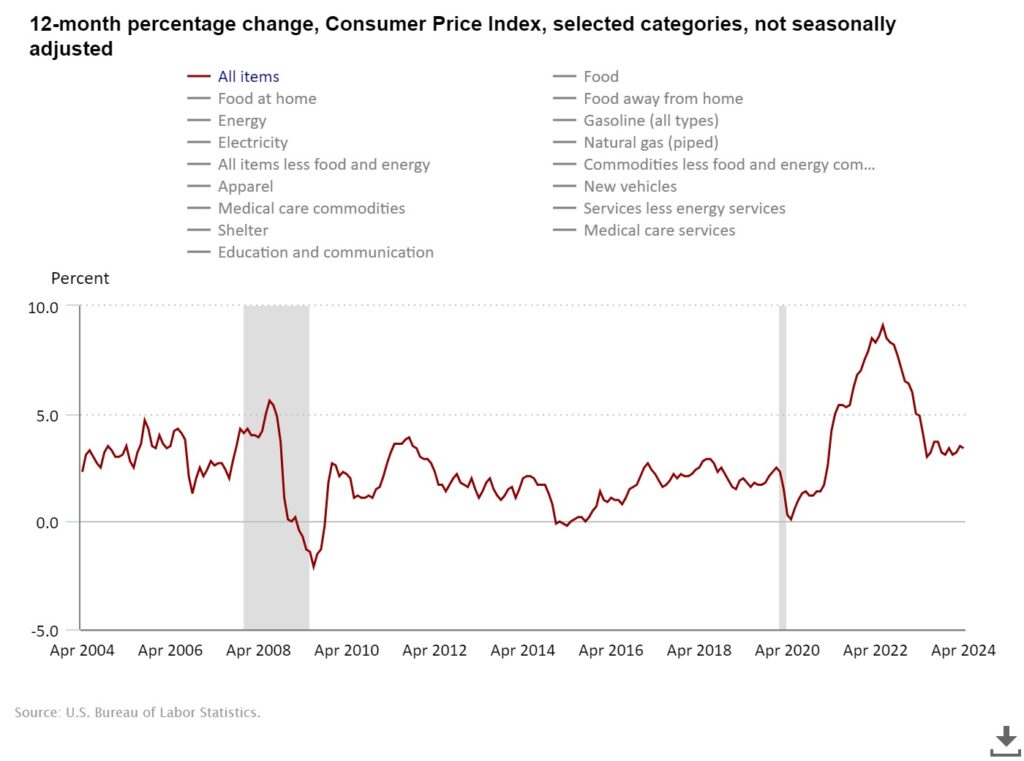
Remember, if rates remain stable, bond prices will not go up or down over time. While inflation has dropped from its June 2022 peak of 9.1% (annual basis) to 3.4% in April 2024, it has remained in the 3-4% range for the past 12 months. Are we in a new normal? Below is inflation chart since 2004.

